Does the alcohol consumption of a country influence its beer reviews?
Context
The world can be divided into regions based on alcohol consumption habits.
Rather than thinking of the world as continents and countries, we can think of it as split into four culturally similar, based on alcohol consumption, regions.
We can distinguish these regions as the following:
As you can see the United Kingdom is not a beer country! Which provides an answer to the famous maxim from William Skakesbeer (perhaps he must not have had a lot of friends with these kind of habits):
Overview of the grades given per region
Let's have a look at the mean in the ratings as a function of the drinking habits, for each category:
Don't hesitate to use the zoom to better observe the mean differences and their confidence intervals!
You can also use the dropdown to select the grade category!
It would appear that countries that mostly drink beers, also give them better scores (overall and also in each individual category)! Spirit and wine countries look more demanding, but what is behind this? What does it mean?
In the rest of our analysis, in order to not have too many equations and math in our data story, we will use the convention that all of the result stated as significant will be significant at a 95% confidence level. From now the only equation we are likely to meet is of this kind:
Separation of beer types into more general types
Beer doesn't have much vitamins, that's why you have to drink lots of it. But thankfully, we have 70 different beer styles to be healthy. Let's regroup them into larger categories! Maybe we will find similar trends (better grades given by beer regions) in some beer types and not in others!
Don't hesitate to have a click around to get more details for each category!
Let's examine the grade differences per beer type now!
Now that we have more general types of beer, we can easily compare if the differences between the grades we have still follow the same trend. Will we find the same pattern (eg. better grades in beer countries)?
For all the scores and for each different type of beer, we observe that beer countries seem to give better scores. Using a bootstrap procedure, the difference between the average scores of the beer countries and the other countries was found to be significant. Countries with beer as their main alcohol consumption seem to be more inclined to give good ratings to the beers they rate.
Ranking of the popularity of the types of beer
We consider that the popularity of a type of beer is calculated thanks to the number of reviews on this type of beer compared to the others.
Let's see the ranking of general type of beers popularity (on the left), and for each general type we can observe the repartition for each sub-type (on the right).
Each region has a dedicated proportion of the total number of reviews to different types of beers. Some beers are more popular in a region than in an other, for example, wine regions have 19.39% of their reviews dedicated to Belgian/French Ale which is more than all other regions. This information is shown on the plot thanks to the color of the corresponding bar.
The color of the bar is then determined by the drinking region, where this type of beer is more popular than in other regions.
Don't hesitate to use the cursor to see details on the number of reviews!
Are there differences in the ABV [%] of the more popular beer per region?
Let's now take all the types of beers that we just found more popular in some regions than others, and see if they have any trends in terms of ABV %.
Here are the mean values of ABV % of the beers that are more popular in a region rather than in others:
T-tests were conducted taking a specific region vs all other three regions combined and confirmed that all these
differences are indeed significant!
Surprisingly, the average alcohol percentage in spirit countries is relatively lower than in other countries.
This is rather counter-intuitive, but could be due to the fact that people who often drink hard liquor might prefer to
drink lighter beers to contrast with their general alcohol consumption.
Heatmap of the correlations of alcohol ABV [%] and the different grade review
For a given country label, we can wonder about the correlation between the differences in alcohol percentage and the
scores between two types of beer. Is one type of beer more appreciated than another because of a significant difference
in alcohol percentage? And if so, does this difference influence the scores of these beers positively or negatively?
On the different heatmaps below, the convention is that between two types of beer the corresponding cell will have the value
1 if there is a positive correlation between the percentage of alcohol and the grade, the value -1 if the correlation
detected is negative and 0 if no significant correlation is detected.
These heatmaps allow us to observe a rather interesting pattern. There appear to be two sub-groups of beer types for which the extra-groups and intra-groups correlation appears to be relatively similar across each country label and grade. The groups that appear are Belgian/French Ale, Pale Ale, Bock, Stout/Porter and Others Lagers, Others, Others Ales, Lambic. The correlation between types of these two groups seems to be generally positive, whereas correlations between two types of the same group seem to be rather negative or neutral. This could be due to the fact that one of the identified groups is made up of well-defined beer types, while the other is made up of beer subtypes that have been grouped together into types that are probably less natural.
What do the reviews have to say?
Comments can provide additional information that we would not be able to pick up from grades. First, let's see which are the main topics users like to discuss when reviewing beers. For that, we will vectorize the comments into a Tf-idf matrix, and apply a Kmean clustering. The 4 main topics in the comments are presented below. Since each list of words correspond to the centroid of a cluster, we can conclude that these words are a good representation of the topic for a cluster.
We found out that Cluster 1 contains most of the comments. Therefore, the main topic in the reviews seems to be a positive sentiment and the use of beer related words. This first cluster represents the main attributes used to describe a beer mixed positive words. On the other hand Cluster 2, 3 and 4 were found to contain less comments and seem to represent more specific topics than Cluster 1. Each one of these clusters focuses on special beers in terms of aroma and taste (Cluster 2 focuses on brown, dark, caramel beers; Cluster 3 focuses on fruity flavors such as cherry, sour… and Cluster 4 is focused on chocolate and coffee flavours).
Now that we know which are the main topics in the comments, let's see if your drinking habits are linked to the topics you will discuss when reviewing! It looks like wine drinkers are more represented in the first and more general cluster. However, spirit drinkers tend to be more linked to fruity (Cluster 2) and dark/brown beer (Cluster 3). The last cluster, related to chocolate and coffee beers, has a majority of beer reviewers.
Do some regions write in a more complexe way than others?
Now, let's study the complexity of the comments! Here, we used the Dale-Chall readability grade with a range between 0 and 100. It assesses the comprehension difficulty of a reader when reading the comment. In order to define if a comment has difficult words, the algorithm will, putting other things aside, compare these words to 3000 words commonly used by an average fourth-grade American student.
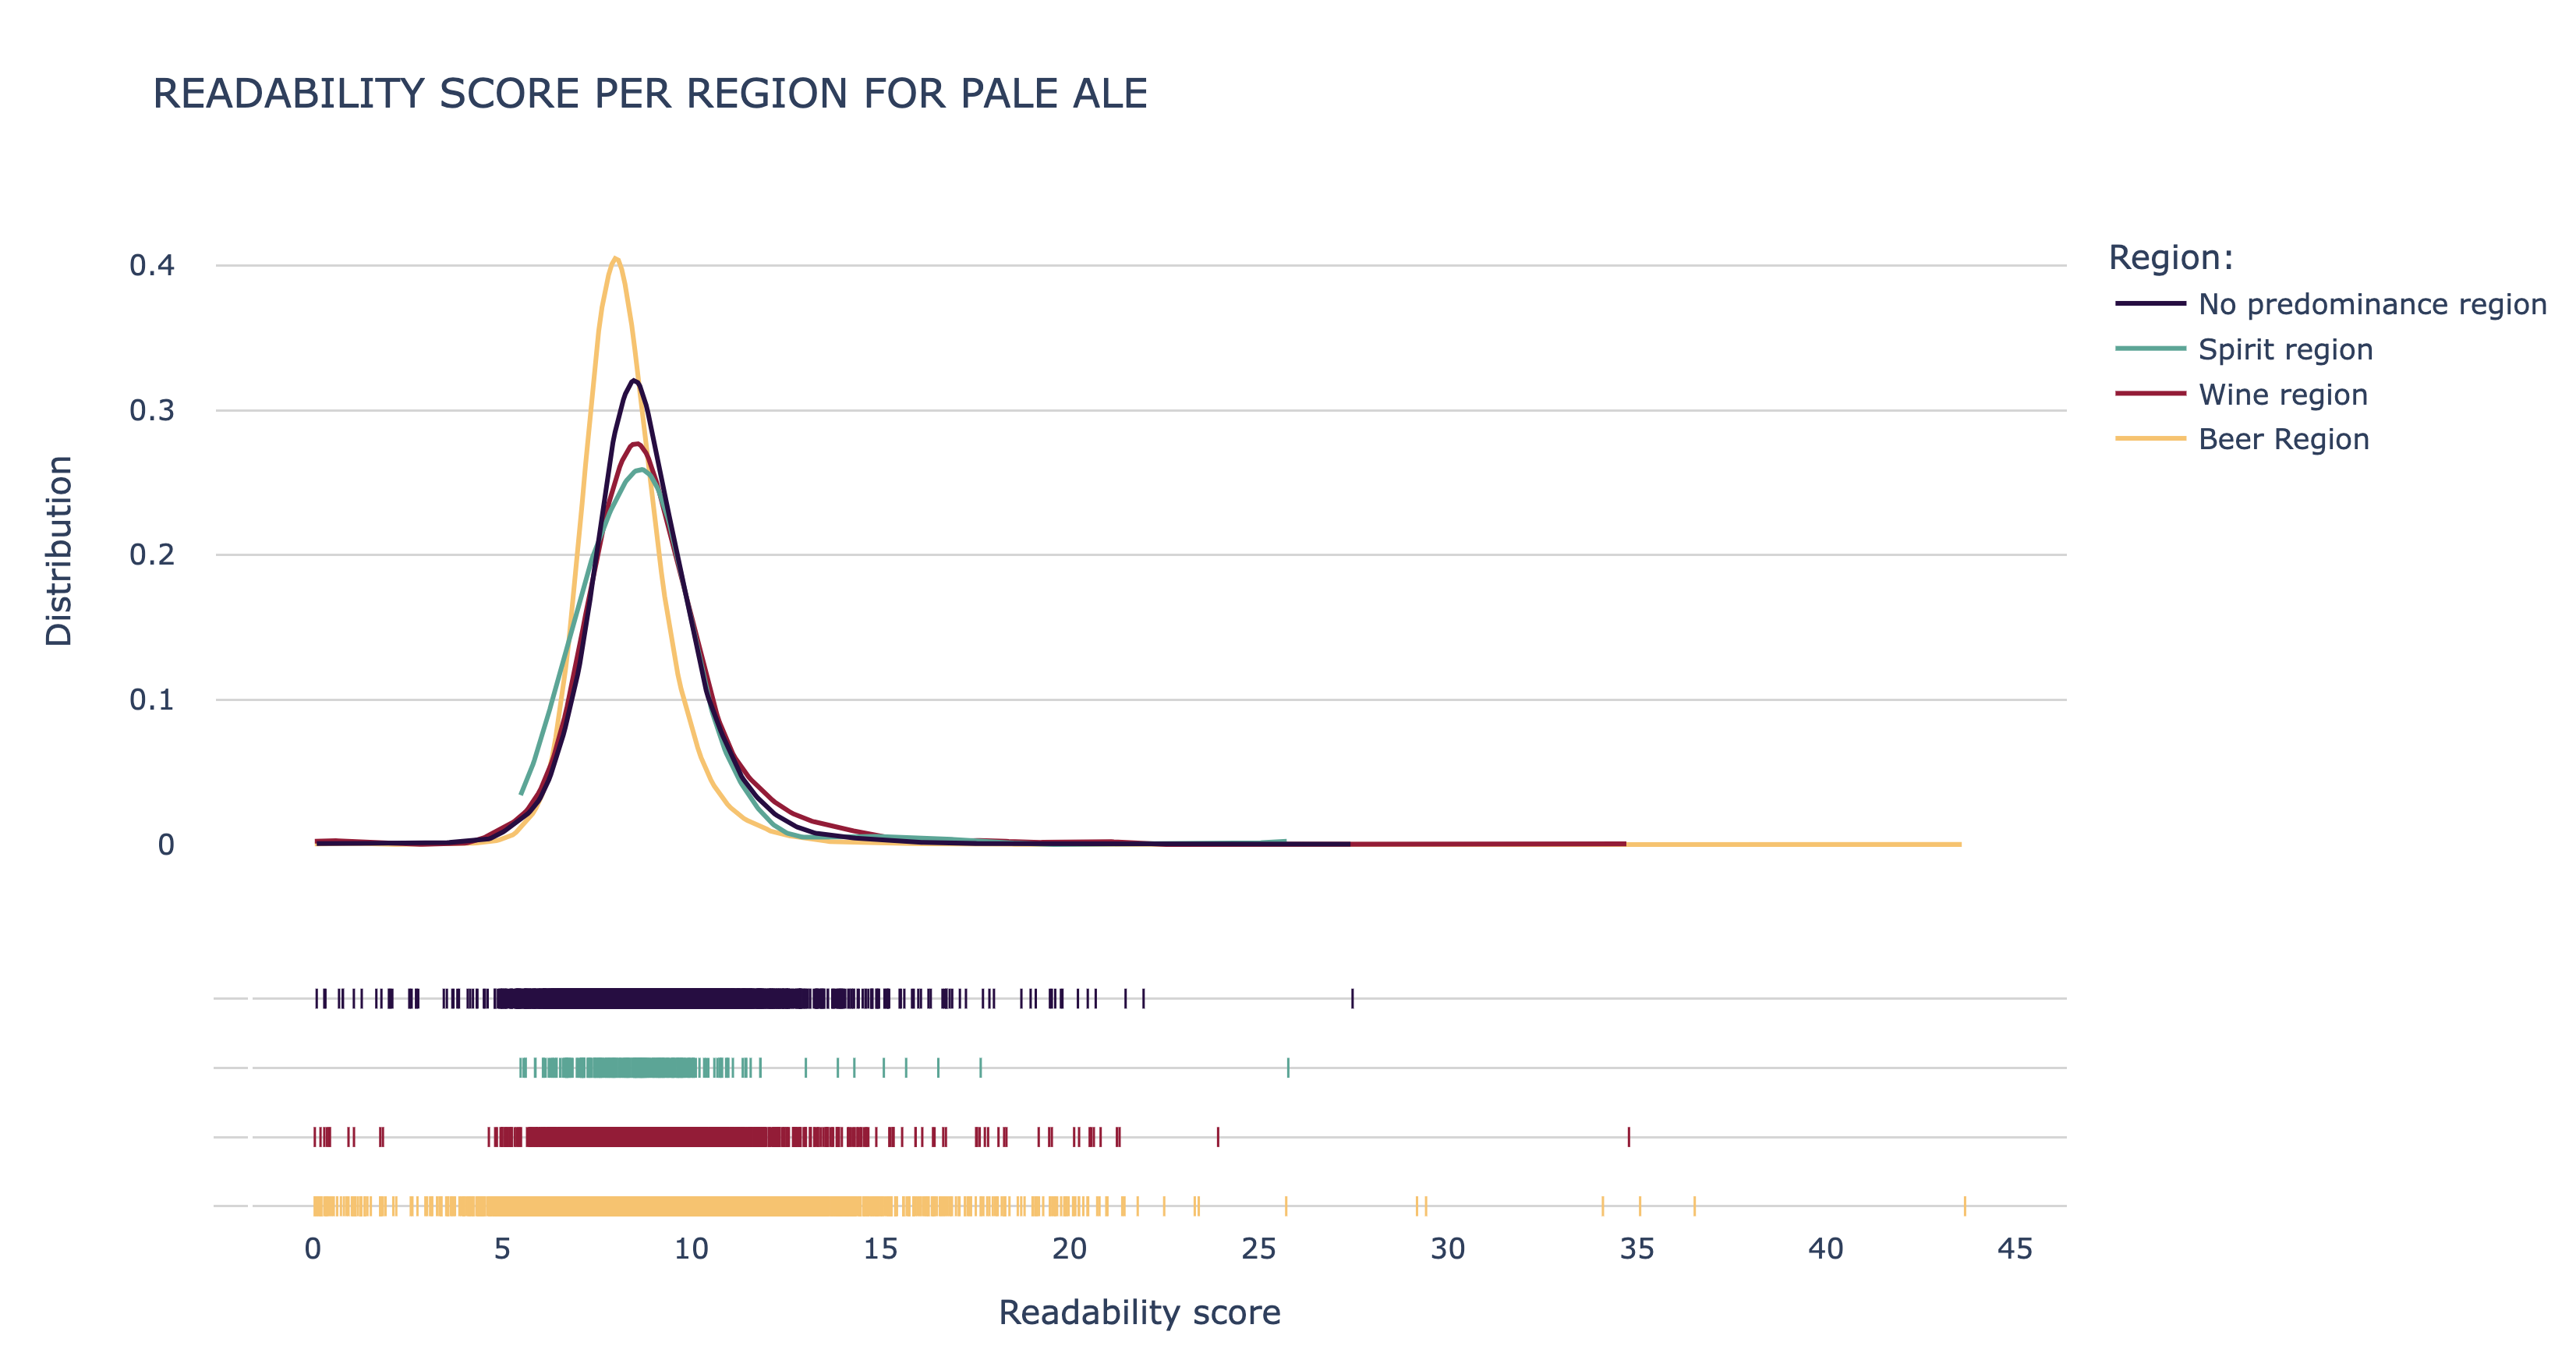
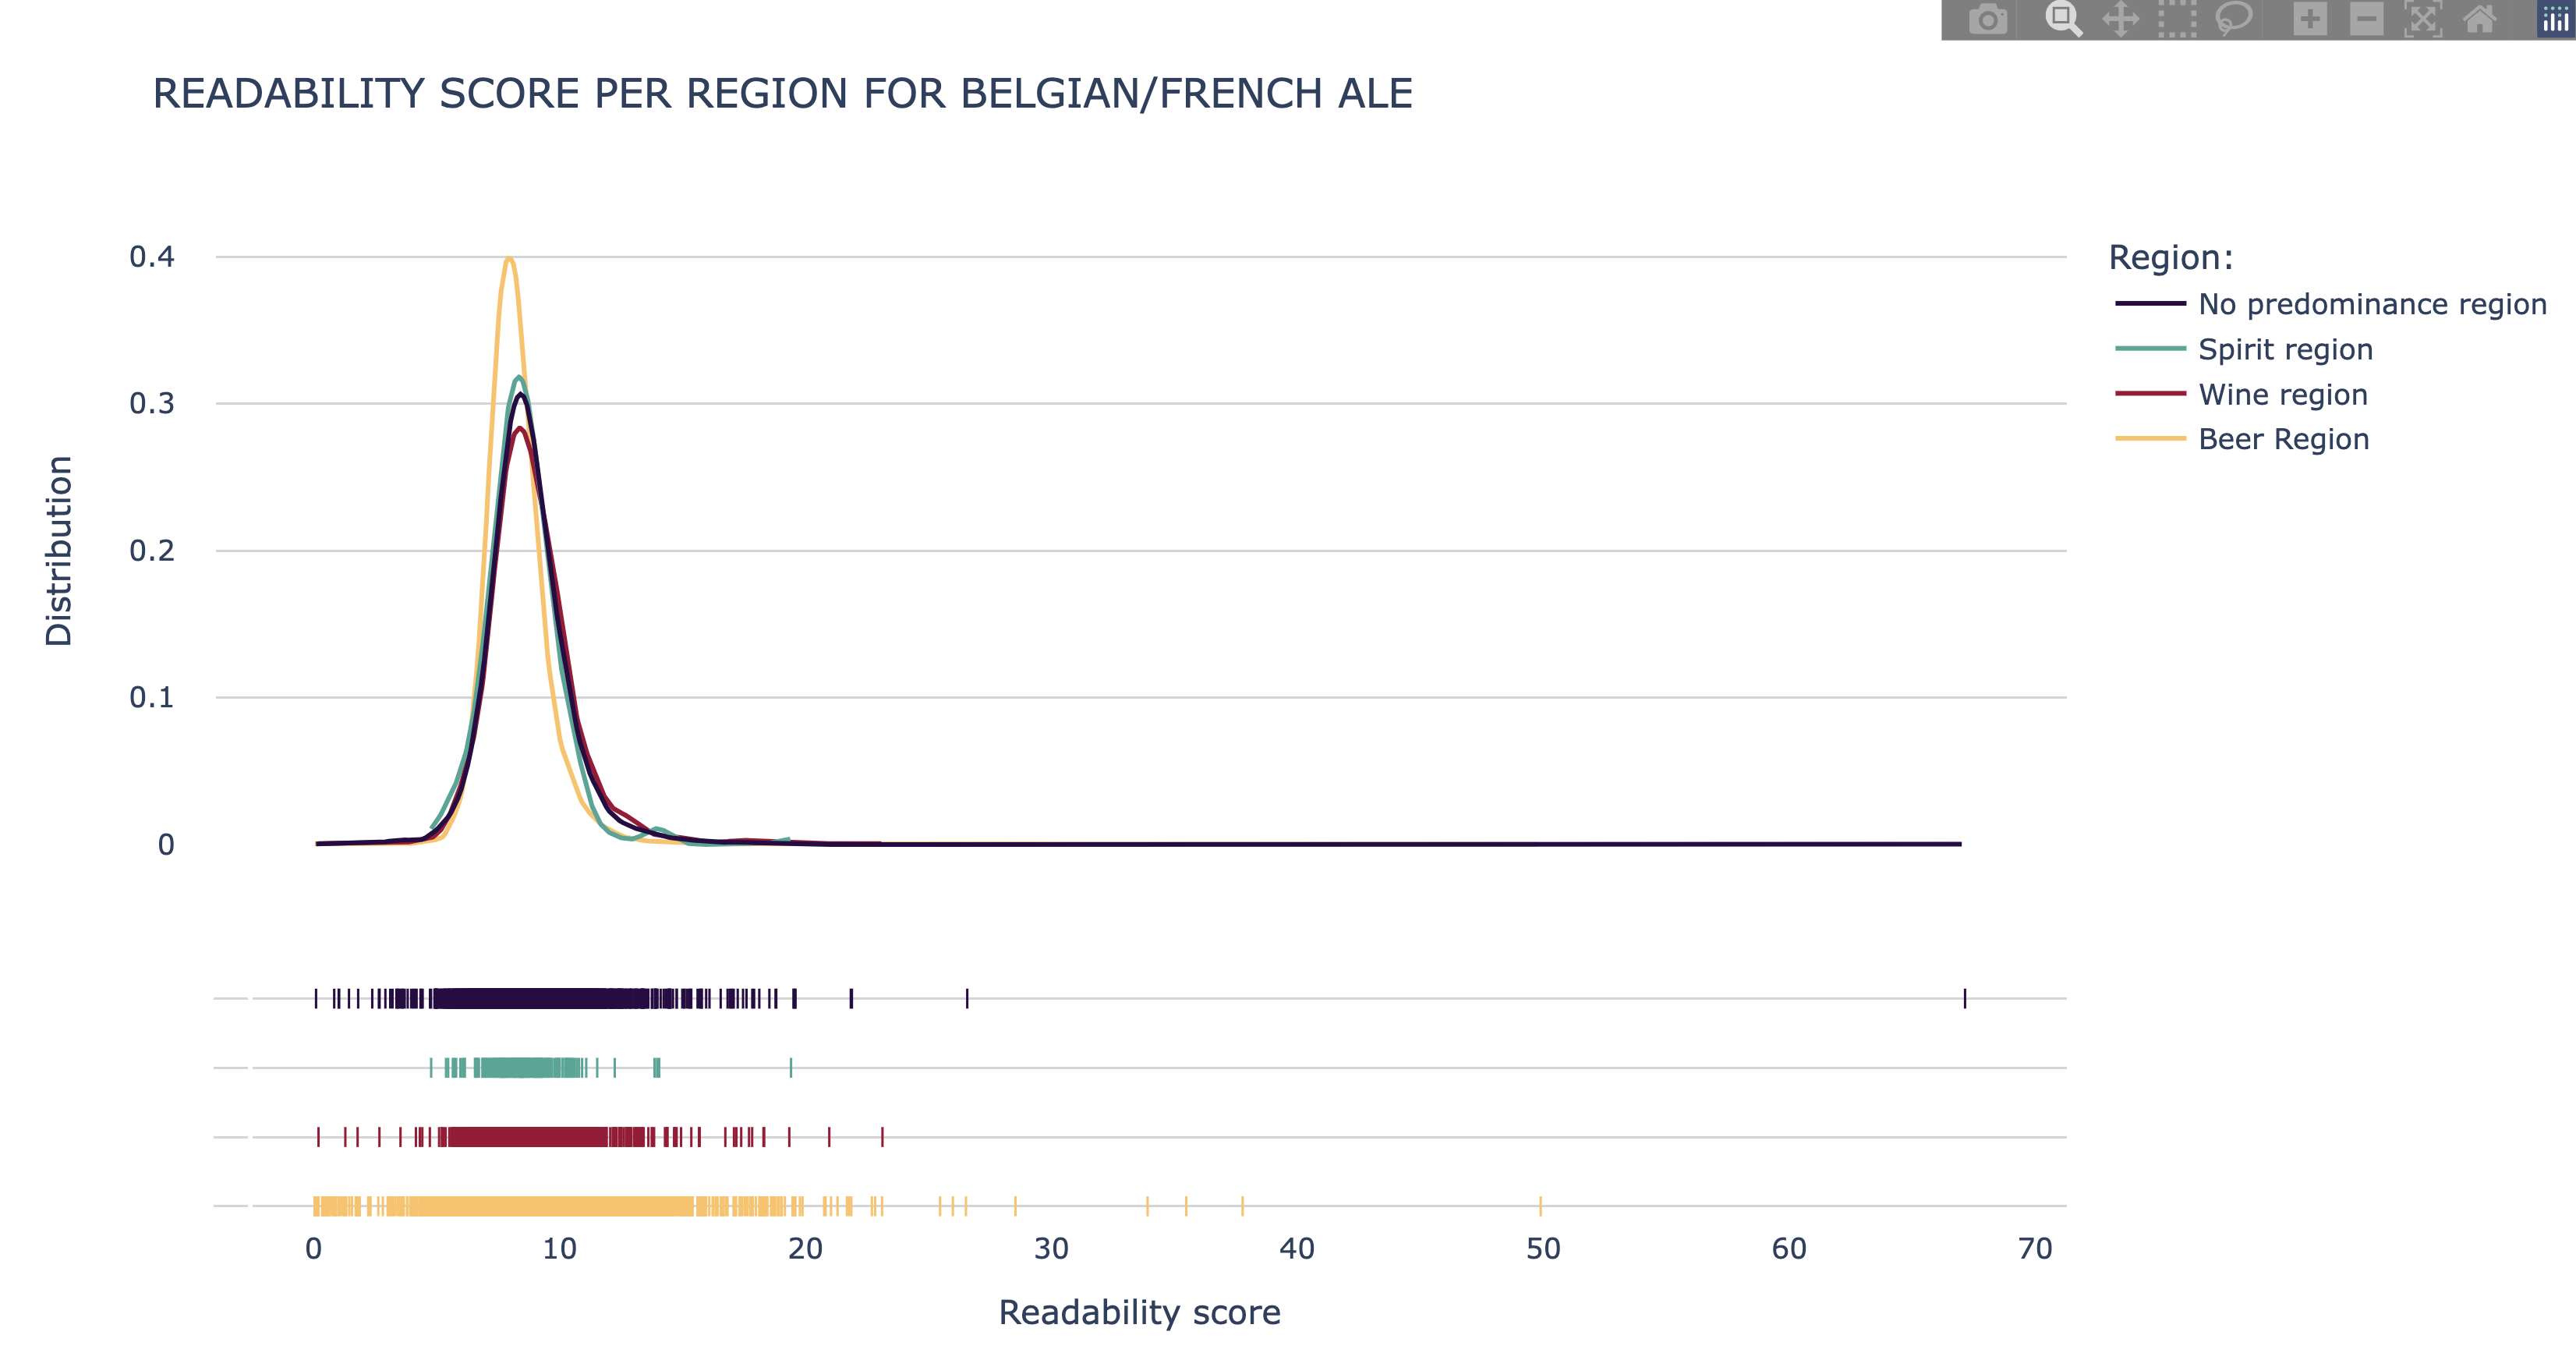
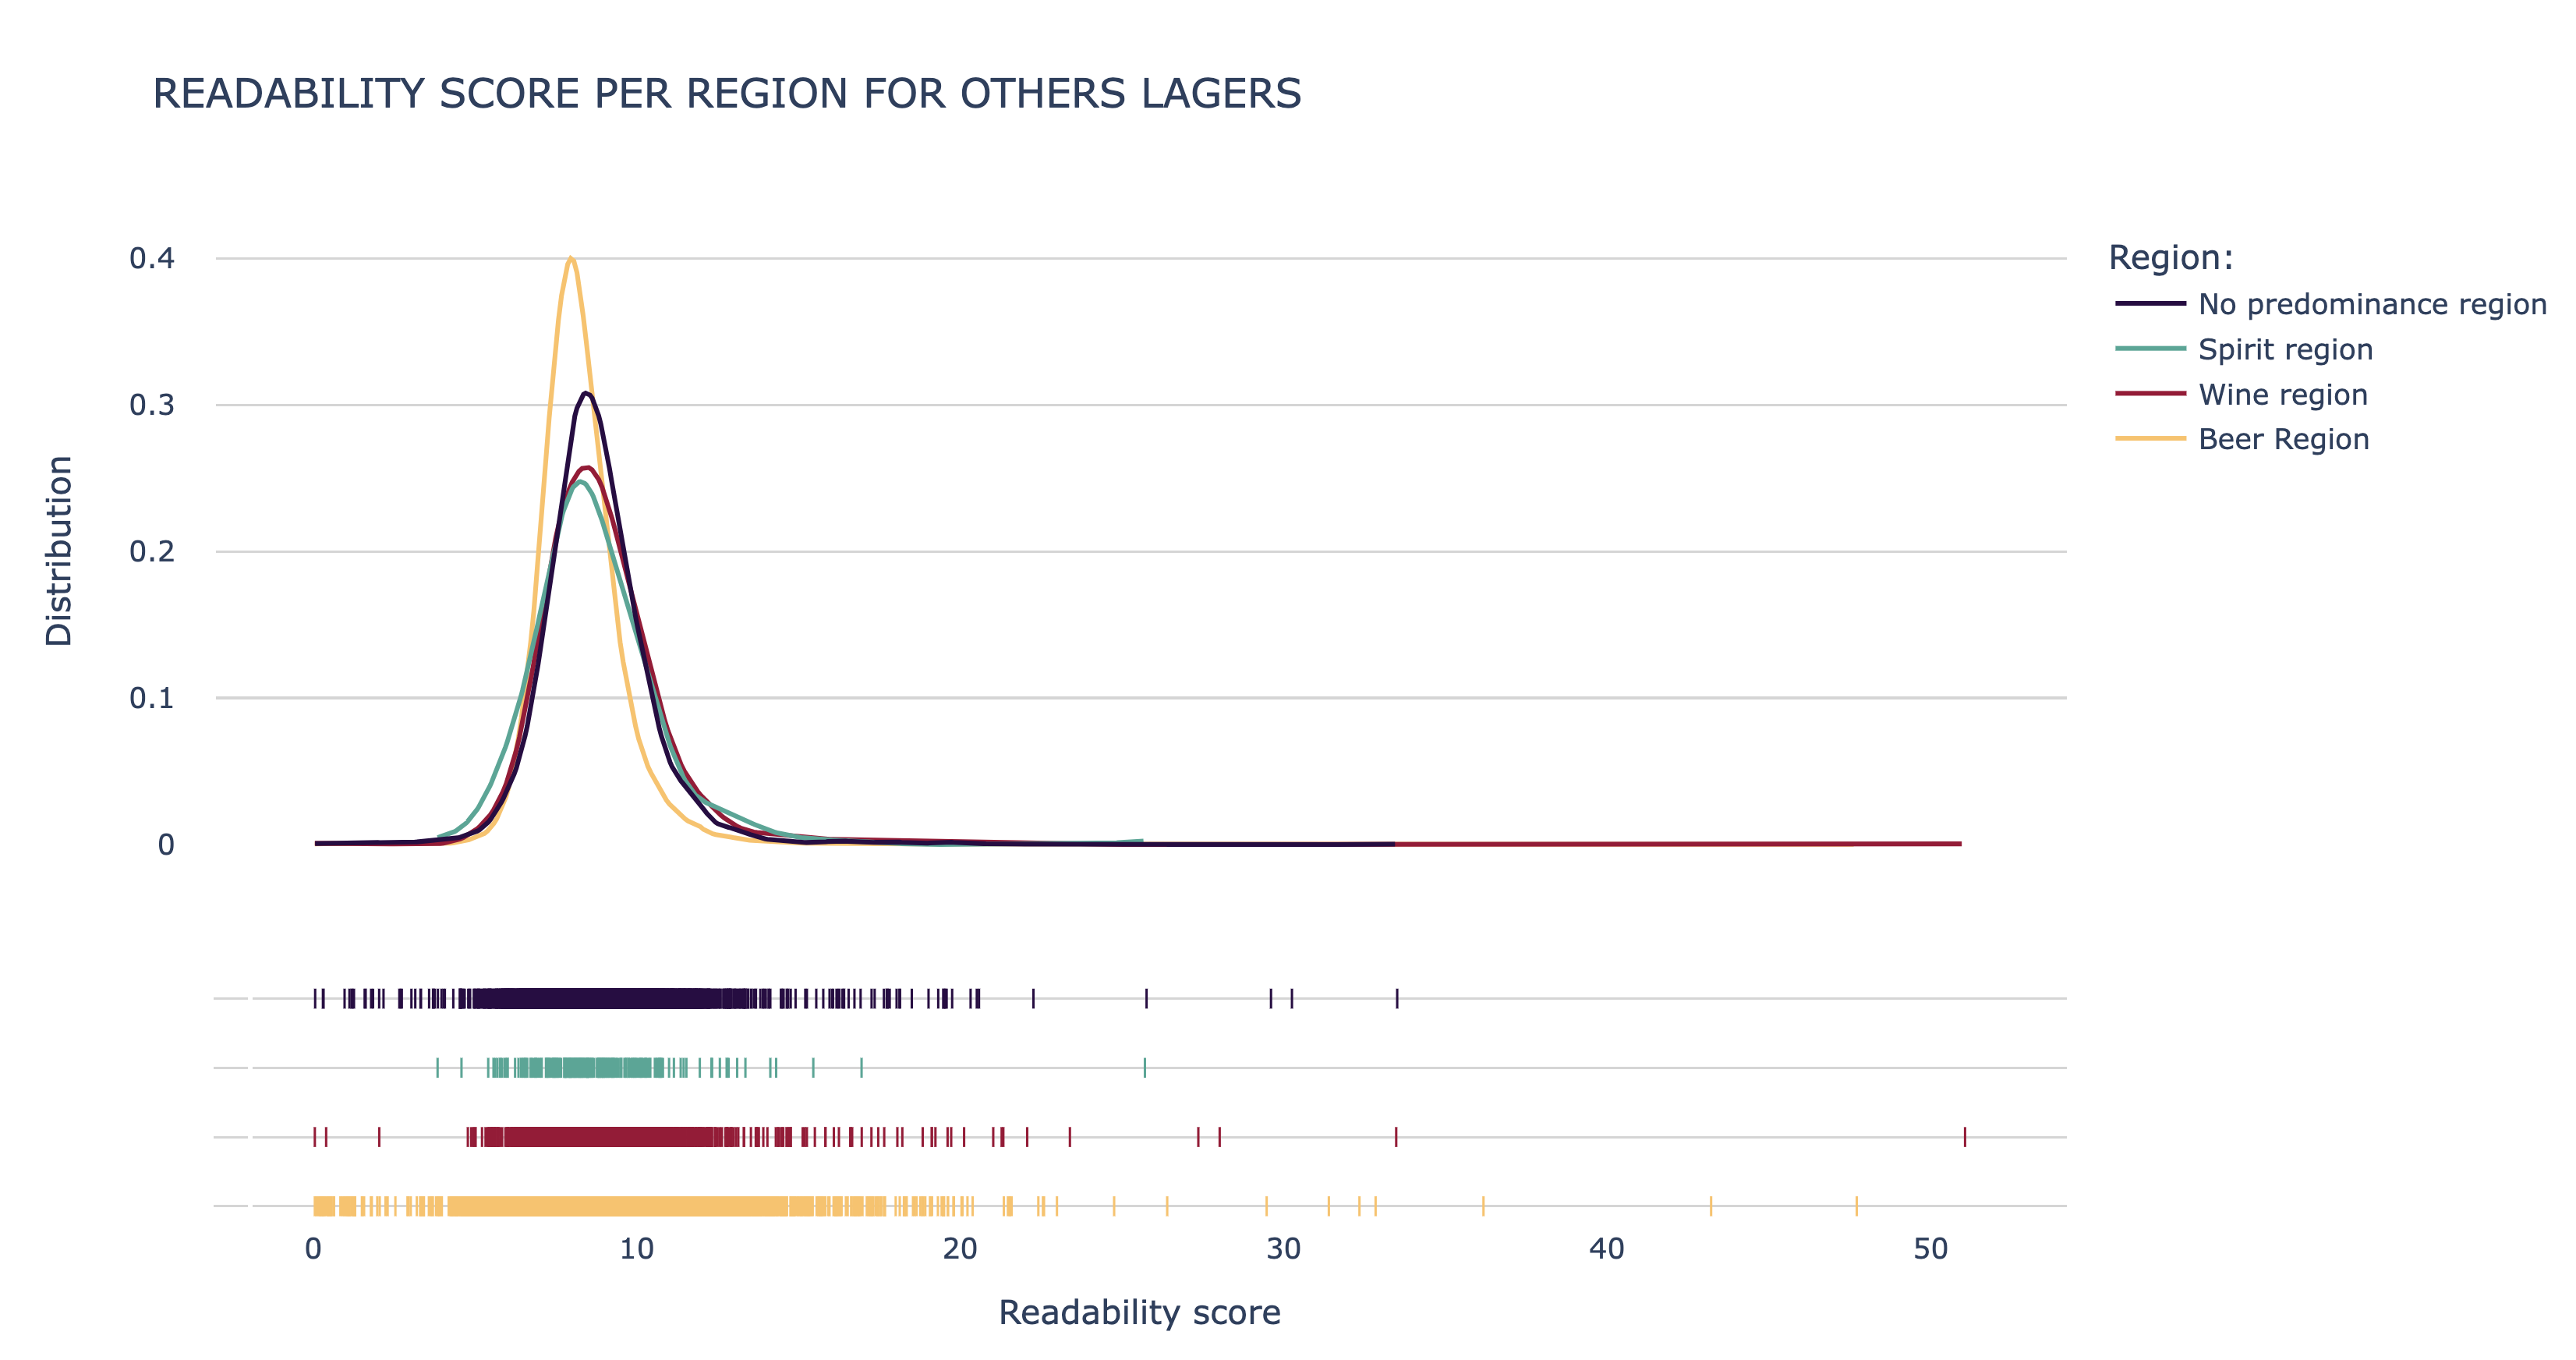
Visually, there is a certain difference between the distribution for the regional beers and that of the other regions. The readability score seems to be visually lower in the beer regions, which was confirmed by a test that allows us to conclude that the average readability score in the beer regions is significantly lower than in the other regions.
Do some regions express themselves in a more positive/negative way?
Comments can reflect sentiments, and this can be studied across the different drinking habit regions. The sentiment score we use goes from -1 to 1 (where -1 is a negative comment, 0 is neutral and 1 is very positive). We can see that overall, the mean sentiment of the reviews is positive! Indeed, the main topic we found during the clustering analysis also suggested that a lot of comments used positive words. We found out beer drinkers tend to write more positive comments, and this happens to be true for all types of beers. Here are the results for the 3 types of beer where the sentiment difference was the most significant.
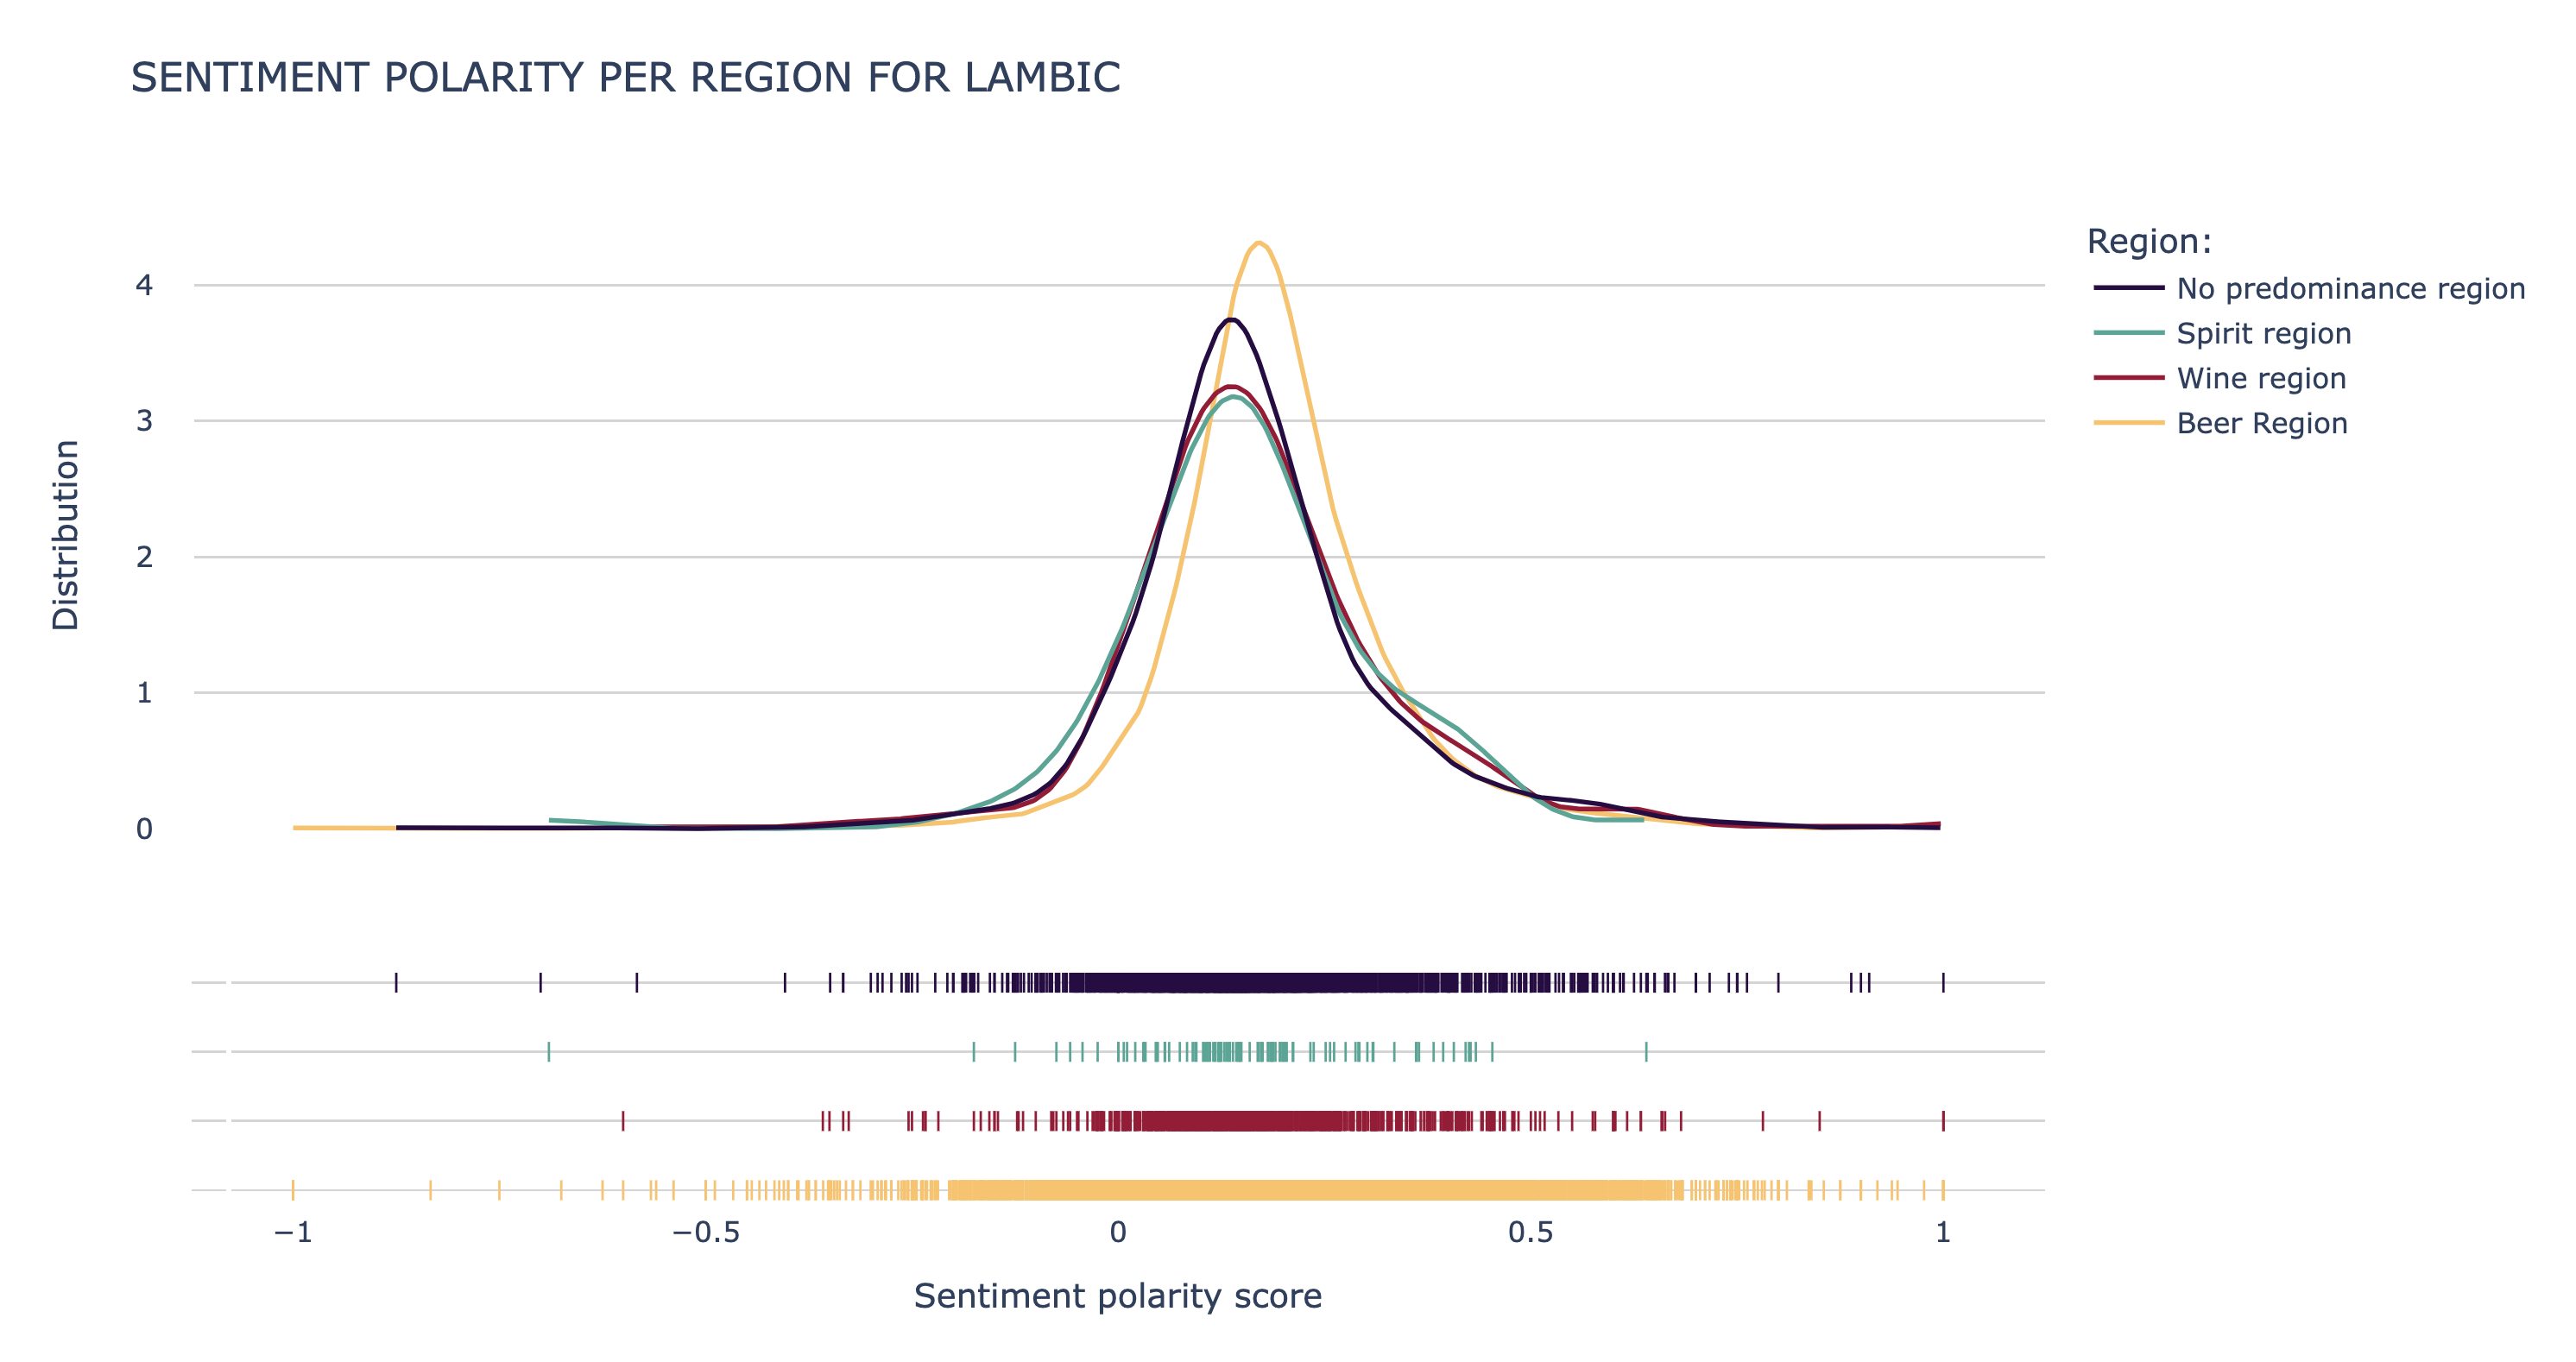
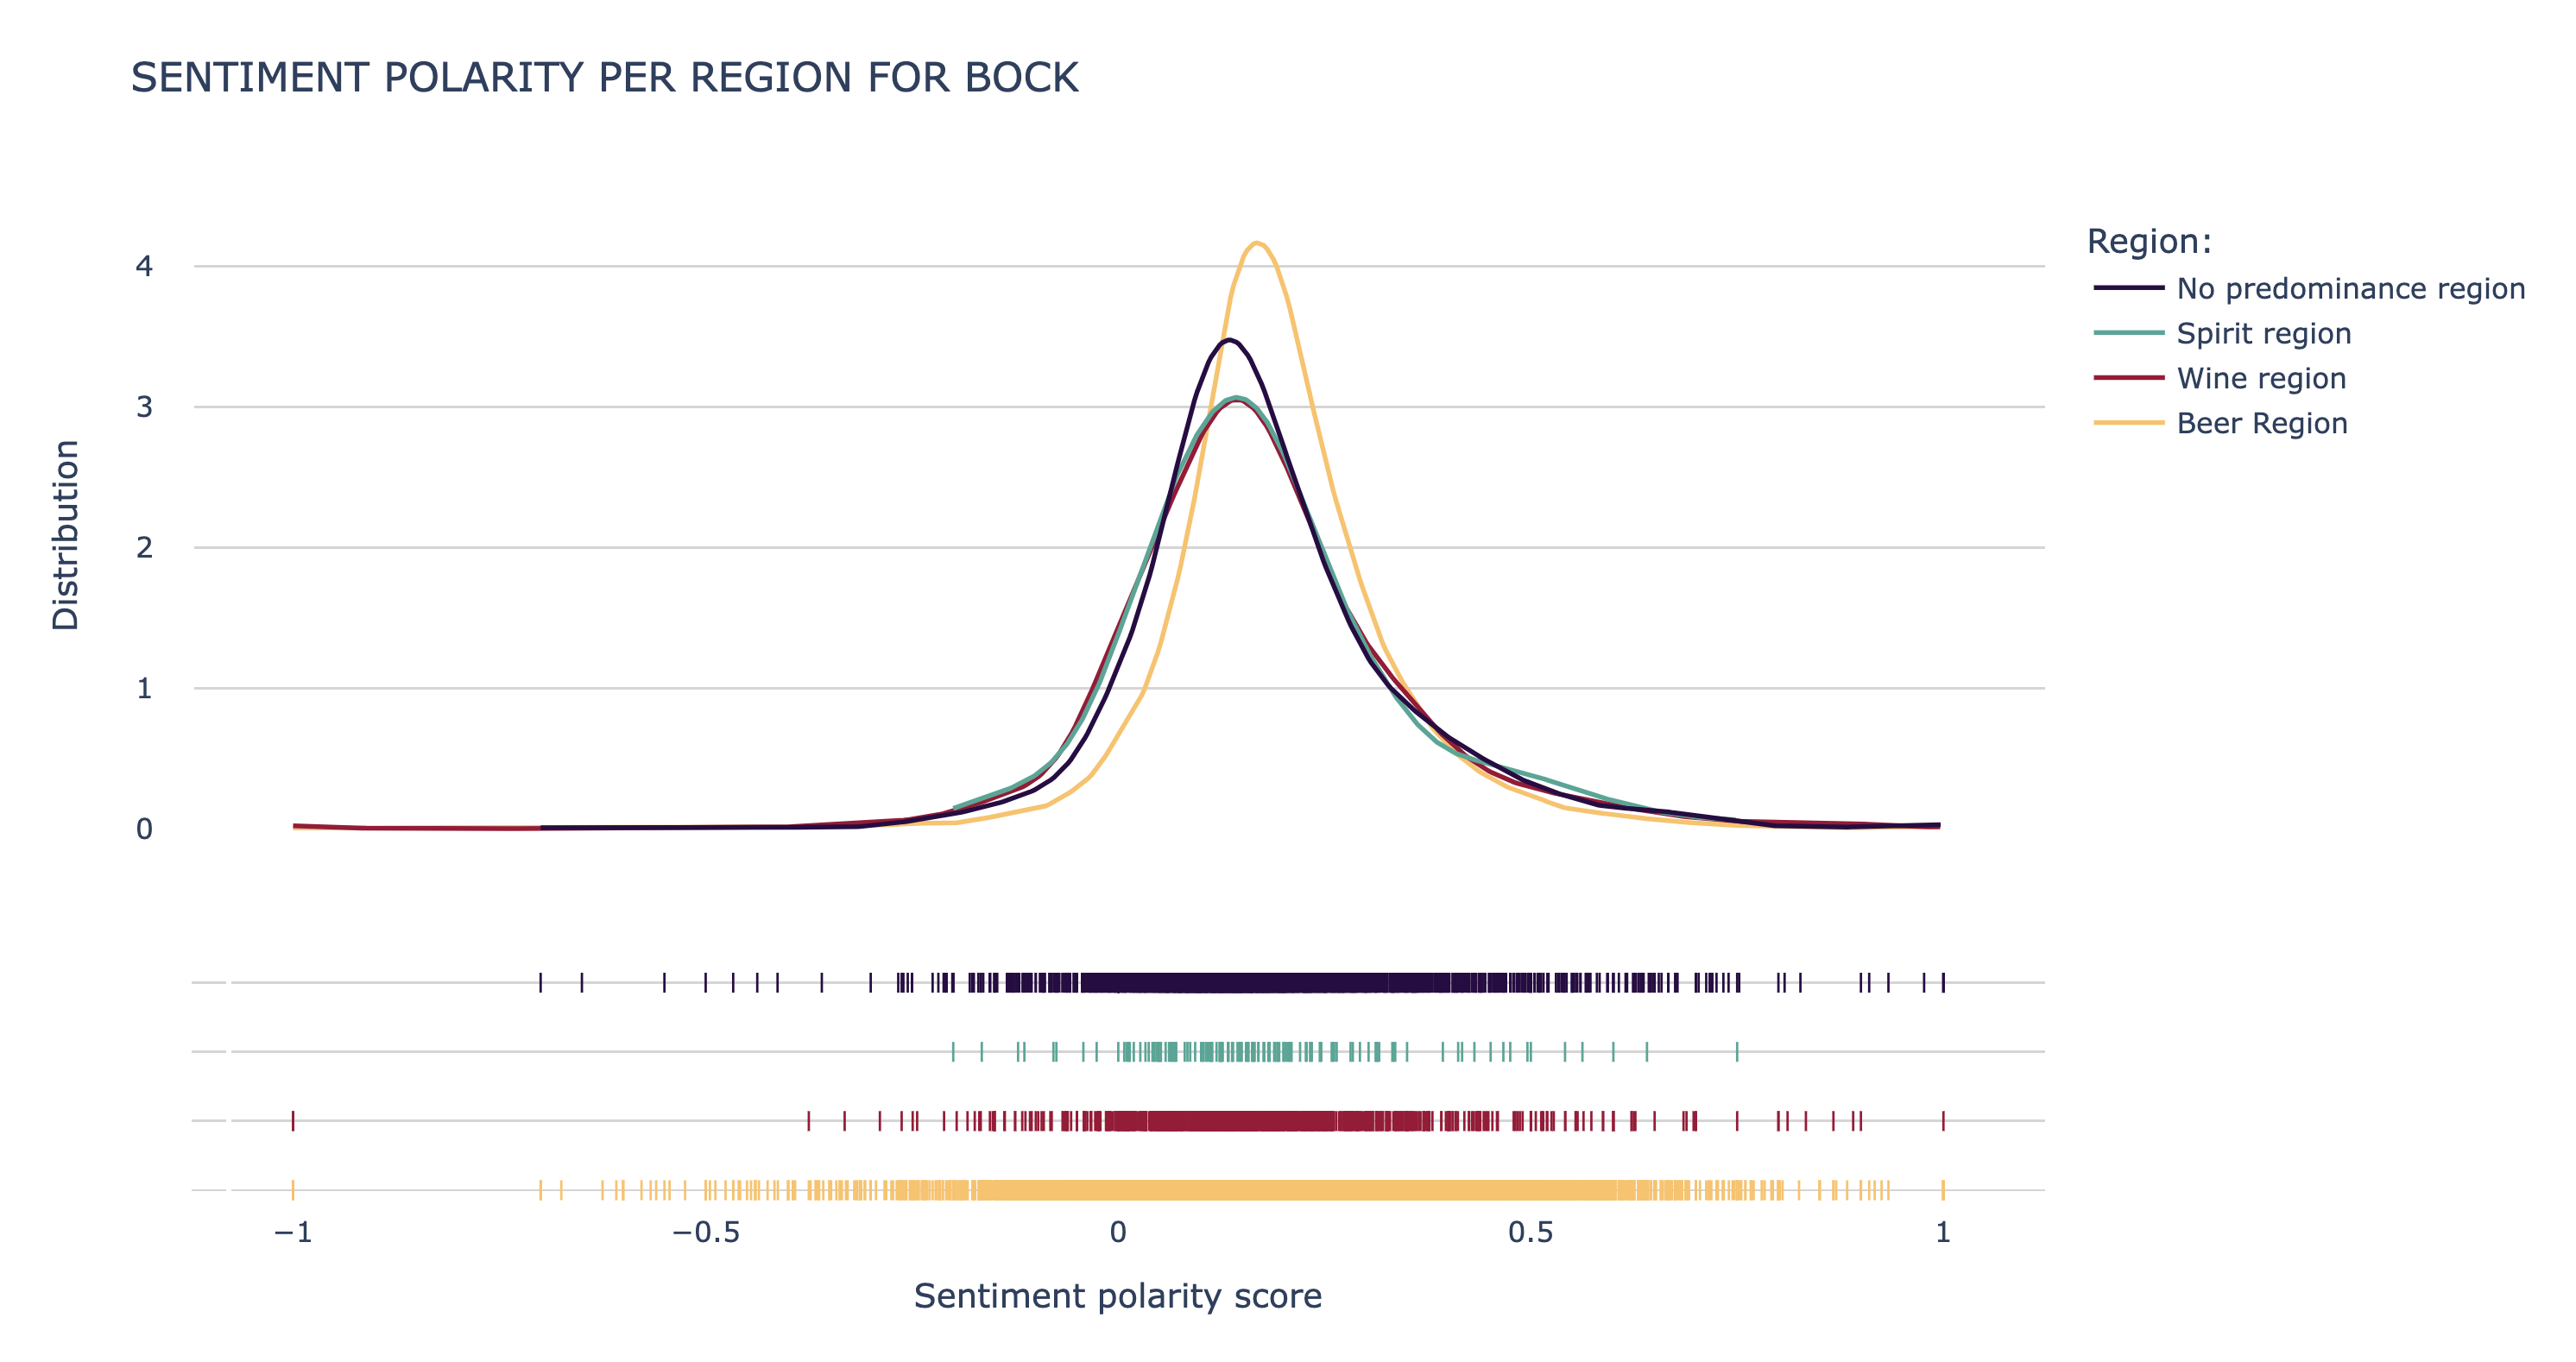
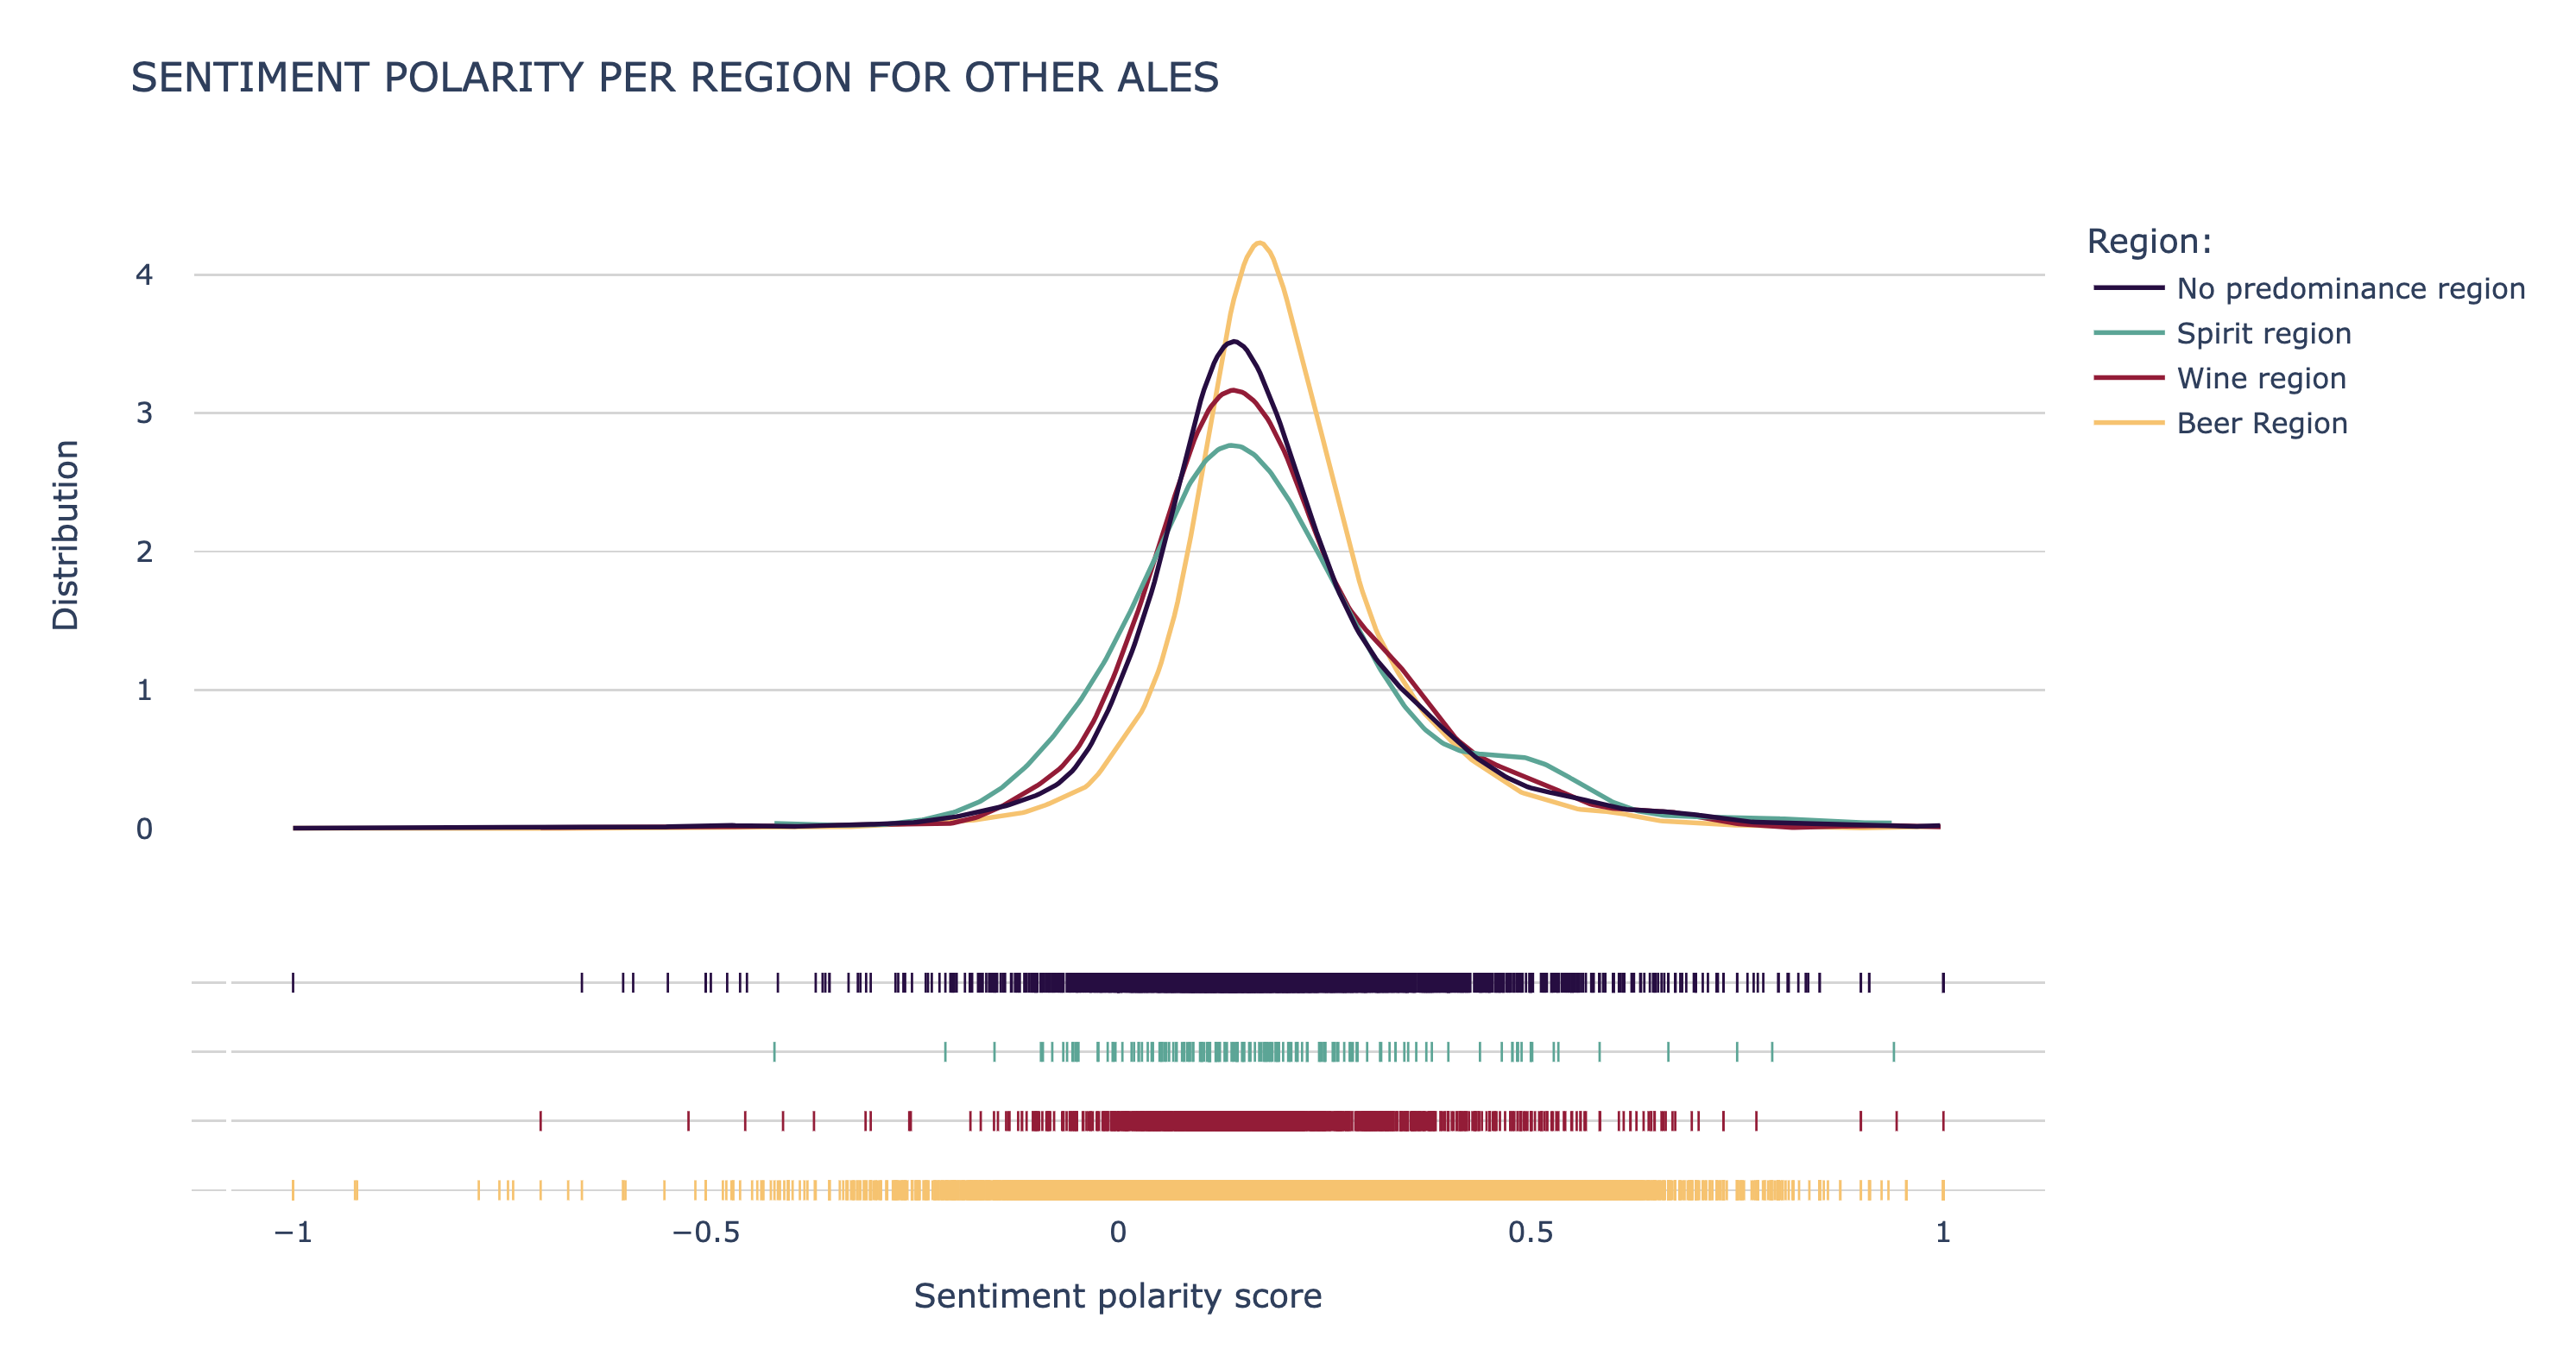
Again, there is some difference between the distribution for the beer region and the other regions. The sentiment polarity score seems visually more important in the beer regions, which was confirmed by a test that allows us to conclude that the average sentiment polarity in the beer regions is significantly higher than in the other regions.
What do they say?
As we already mentioned, the countries were split in four categories according to their principal alcohol consumption. We also grouped the beer types in 8 main groups. We then computed, per principal beverage and general beer type, the most used words. The idea behind this is to determine if the alcohol consumption habits influences the word choice. Of course there are a lot of words in common, but let's try and spot the differences.
Here are the word clouds for each region, for Belgian/French Ale:
In this first word cloud about Belgian/French Ale, we can see that beer regions used words such a citrus, fruity or spice that don't come up as much in the other regions. Spirit and wine used the words like roasted and caramel to describe this type of beer.
Here are the word clouds for Pale Ale:
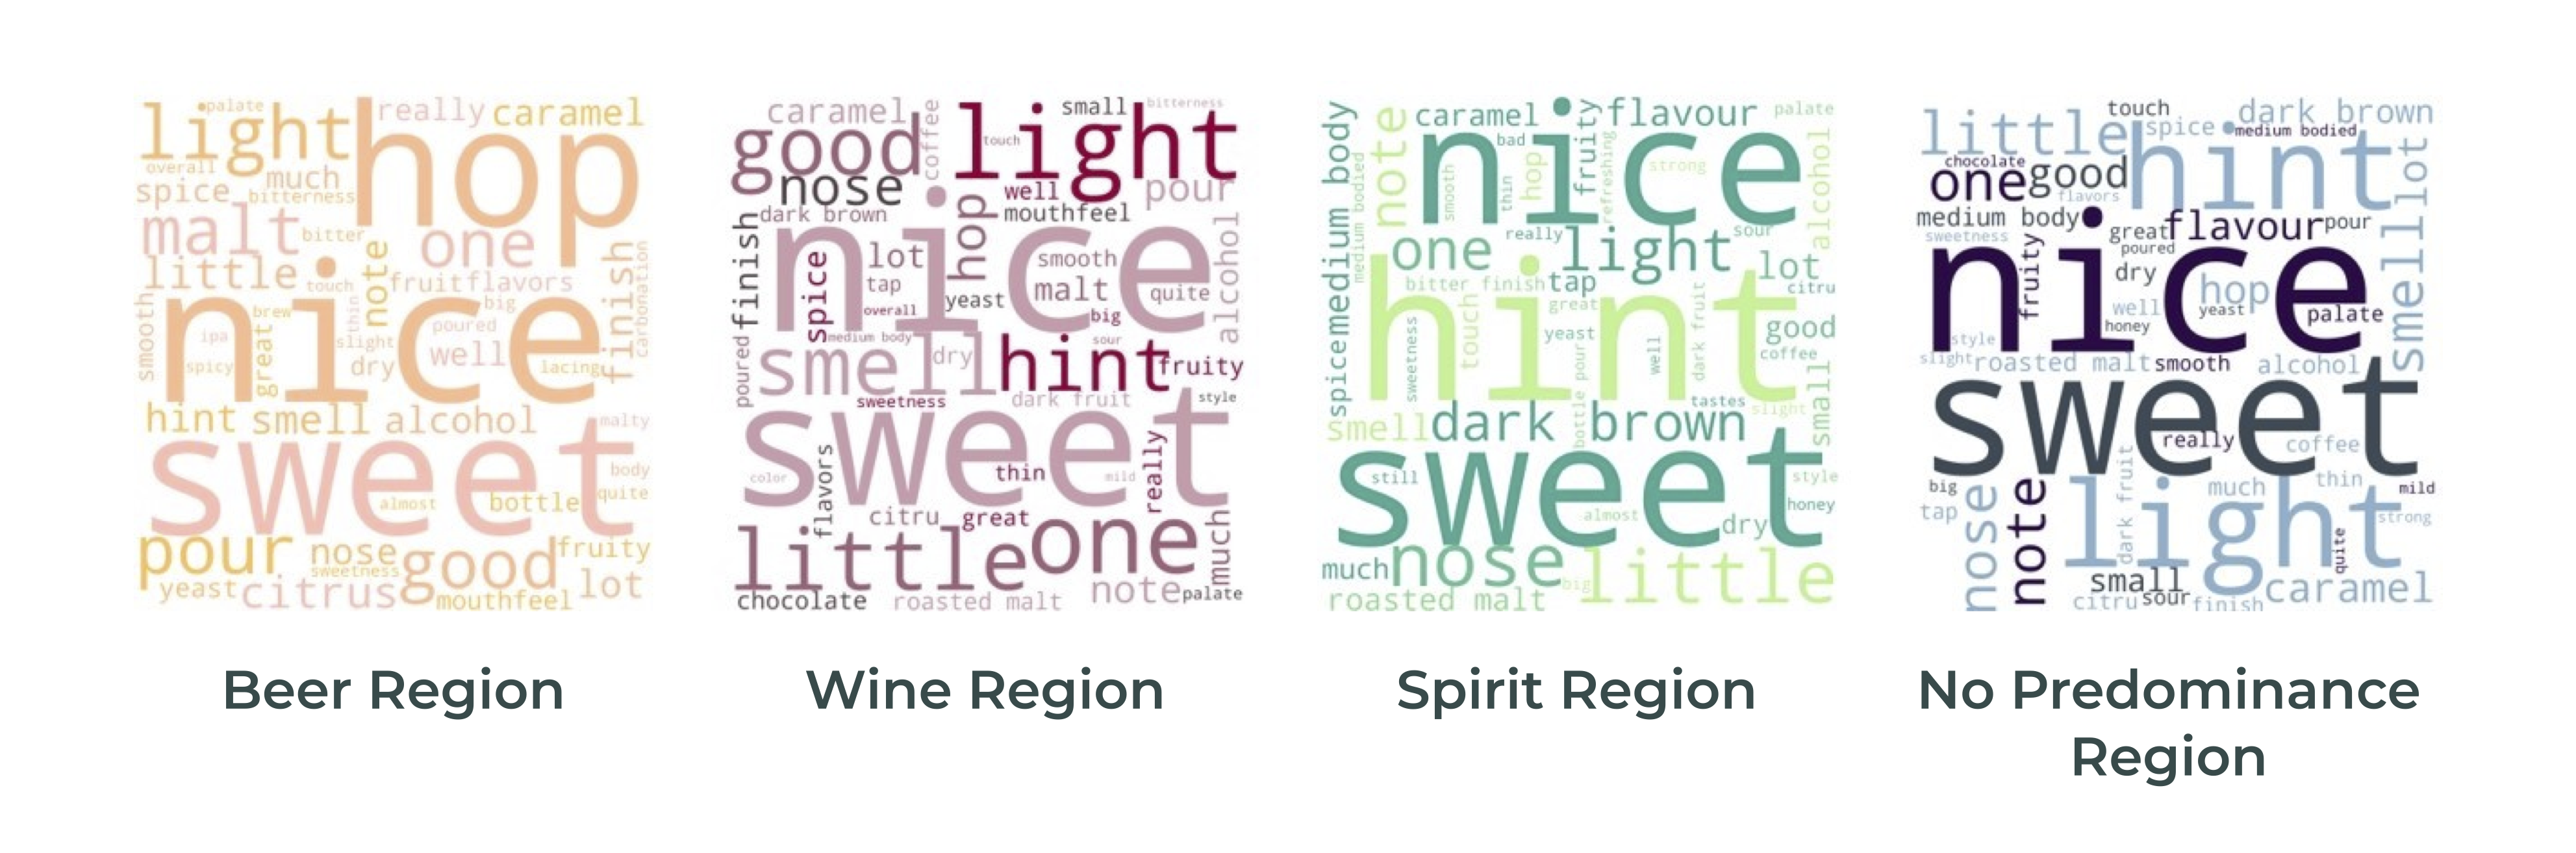
For the Pale Ale, beer regions have malt and sweet as a word choice, while no predominance region and wine region have words like smell and nose. Both wine and spirit talk about caramel.
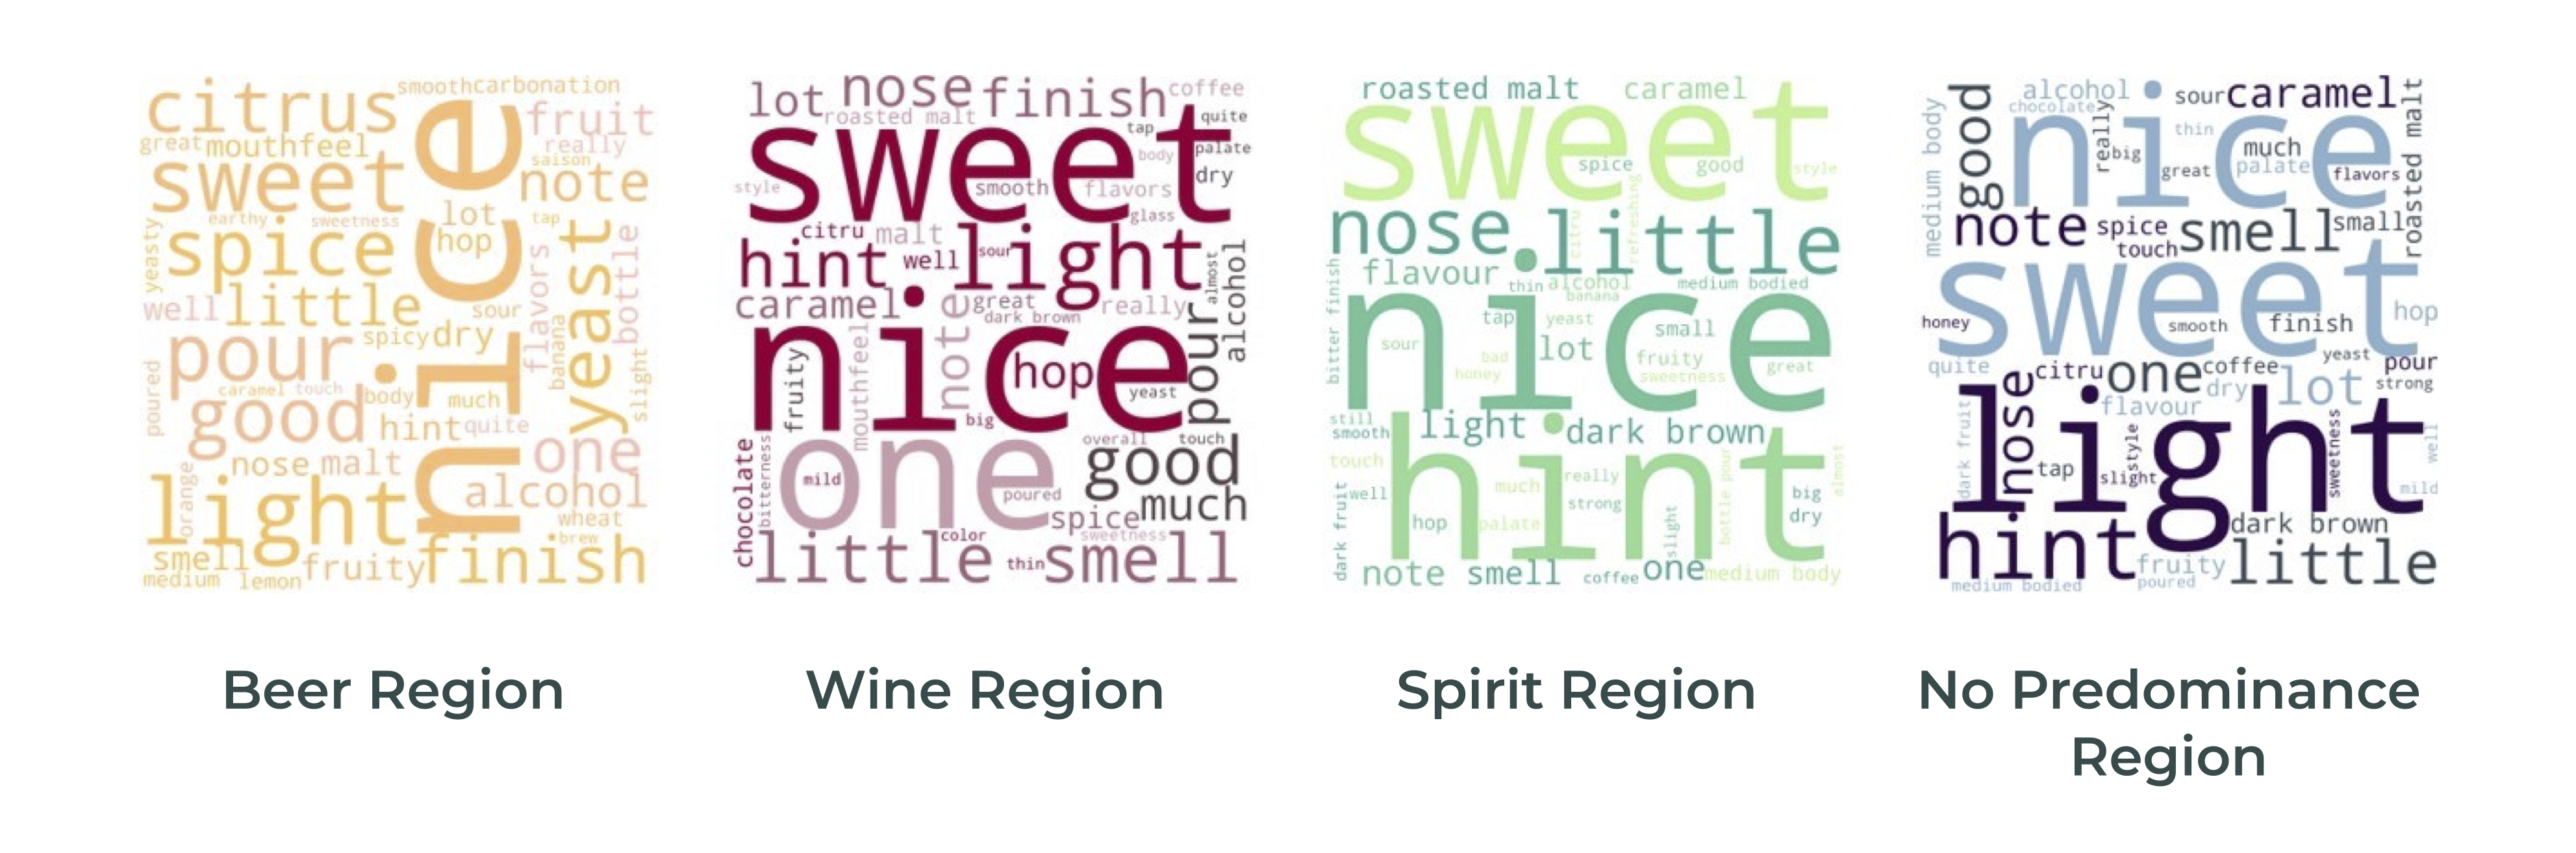
Here are the word clouds for Stout:
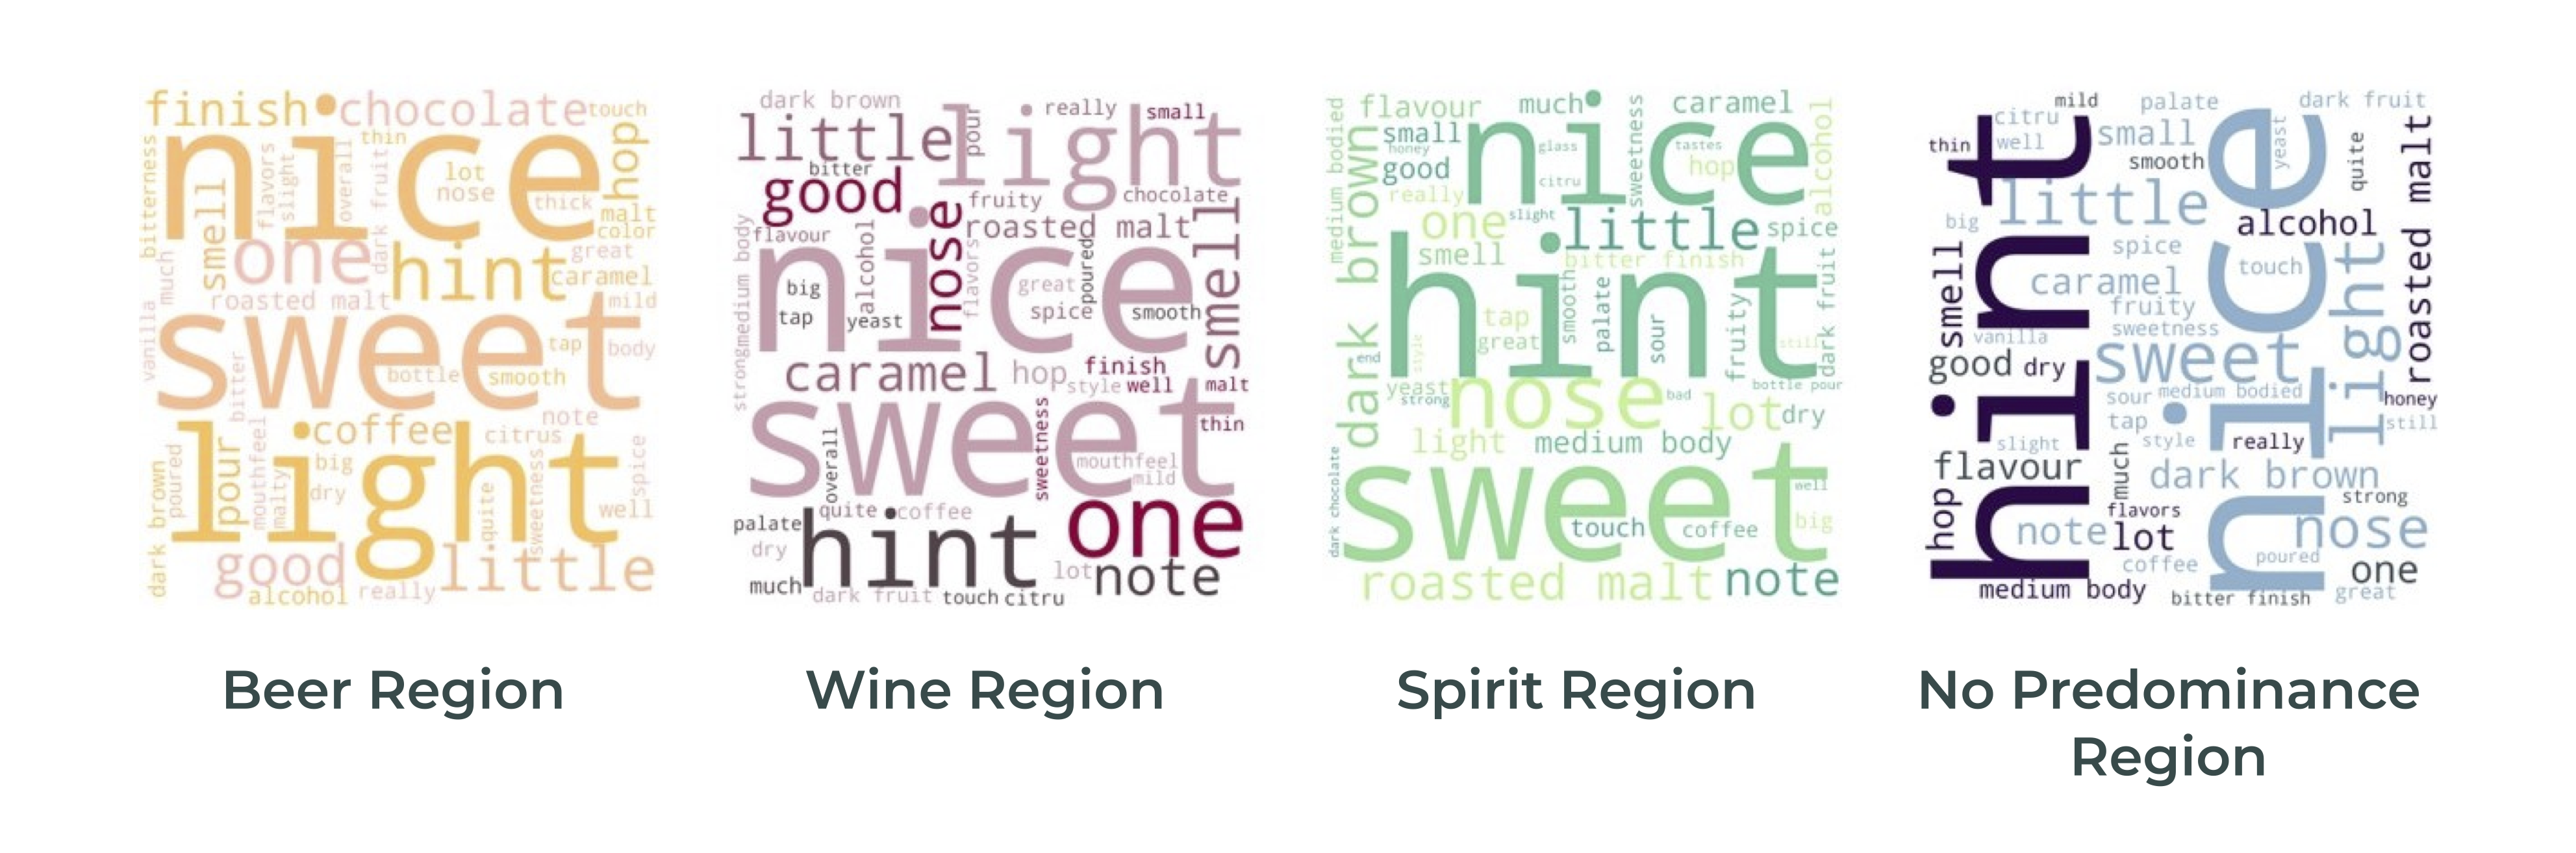
Our last kind of beer is the Stout. Spirit and no predominance talk about roasted malt, the color dark brown and medium body, the beer region talks about chocolate. Are these different word choices to say the same thing?
In conclusion
This study shows rather interesting results. Indeed, we ended up finding results that we had not expected. We would have expected the beer drinking countries to be harsher when grading and reviewing beers, since they would have more knowledge on the subject. However, we found that beer drinking countries tend to give better grades and give reviews with a more positive sentiment than the others. Beer drinkers also write less complex reviews.
We also found out that the spirit regions, which we thought would prefer high ABV % beers, actually preferred lighter beers.
In conclusion, things are not always as they seem, and we should should not always trust stereotypes!